
What Is Visual Content?
Visual content is online content that’s primarily image-based. Common forms of visual content include pictures, diagrams, charts, infographics, online videos, screenshots, memes and slide decks.
Why Is Visual Content Marketing Important?
Visual content is exploding right now.
Highly visual social media platforms, like YouTube and Instagram, are growing fast.
Google’s SERPs are more visual than ever, making image SEO that much more important.
And 37% of marketers cite visual content as their “most important” type of content.

There’s a good reason for that:
Visual marketing is super effective for getting backlinks, social shares and traffic.
There’s data to back this up: an industry study by our team and BuzzSumo discovered that infographics work really well for building links.

So if you’re ready to tap into visual content marketing, here are 15 types of visual content that you can try.
1. The “Concept Visual”
What It Is:
A visual version of a concept, strategy or idea.
Why It Works:
Concepts are hard to explain… but easy to visualize.
And when someone wants to explain that concept on their site, they may use your visual.
(And link back to you.)
Example:
A while back I wanted to describe “The APP Formula”.
The APP Formula is a strategy that helps you write compelling blog post introductions.
But instead of just explaining it, I created a visual version of the concept.

Sure enough, whenever someone talks about The APP Formula on my site, they link back to me:

(This is just one example. This simple visual has netted me AT LEAST 20 backlinks.)
2. Native Video
What It Is:
Video that’s created specifically for one social network, like:
Why It Works:
Facebook wants you to stay on Facebook.
Twitter wants you to stay on Twitter.
And when you post something that takes people AWAY from the platform, your post is gonna get buried.
But if you can keep people on that network, you’re golden.
And native video is the best way to do that.
In fact, BuzzSumo discovered that native videos CRUSH other types of Facebook posts.

Example:
Some time ago I uploaded a short video on LinkedIn:

This content was from a much longer YouTube video.
I just grabbed a clip that would work well on LinkedIn…
…and uploaded it as a native video.
How did the post do?
To date my post has:
888 likes:

And 142 comments:

That’s the power of native video.
3. Ultimate Guides
What It Is:
A complete guide to a topic on a single page.
Why It Works:
Guides give people “one-stop shopping” for information on a given topic.
But for an ultimate guide to work, you need to use a custom-designed page.
Why?
A custom-designed page tells people: “This guide is legit!”.
Example:
A while back I published this guide to link building.

As you can see, it’s NOT a typical blog post.
It’s got lots of useful content… and a design that helps it stand out:

To date, this single piece of content has been linked to 5.79k times.

And has over 500 comments:

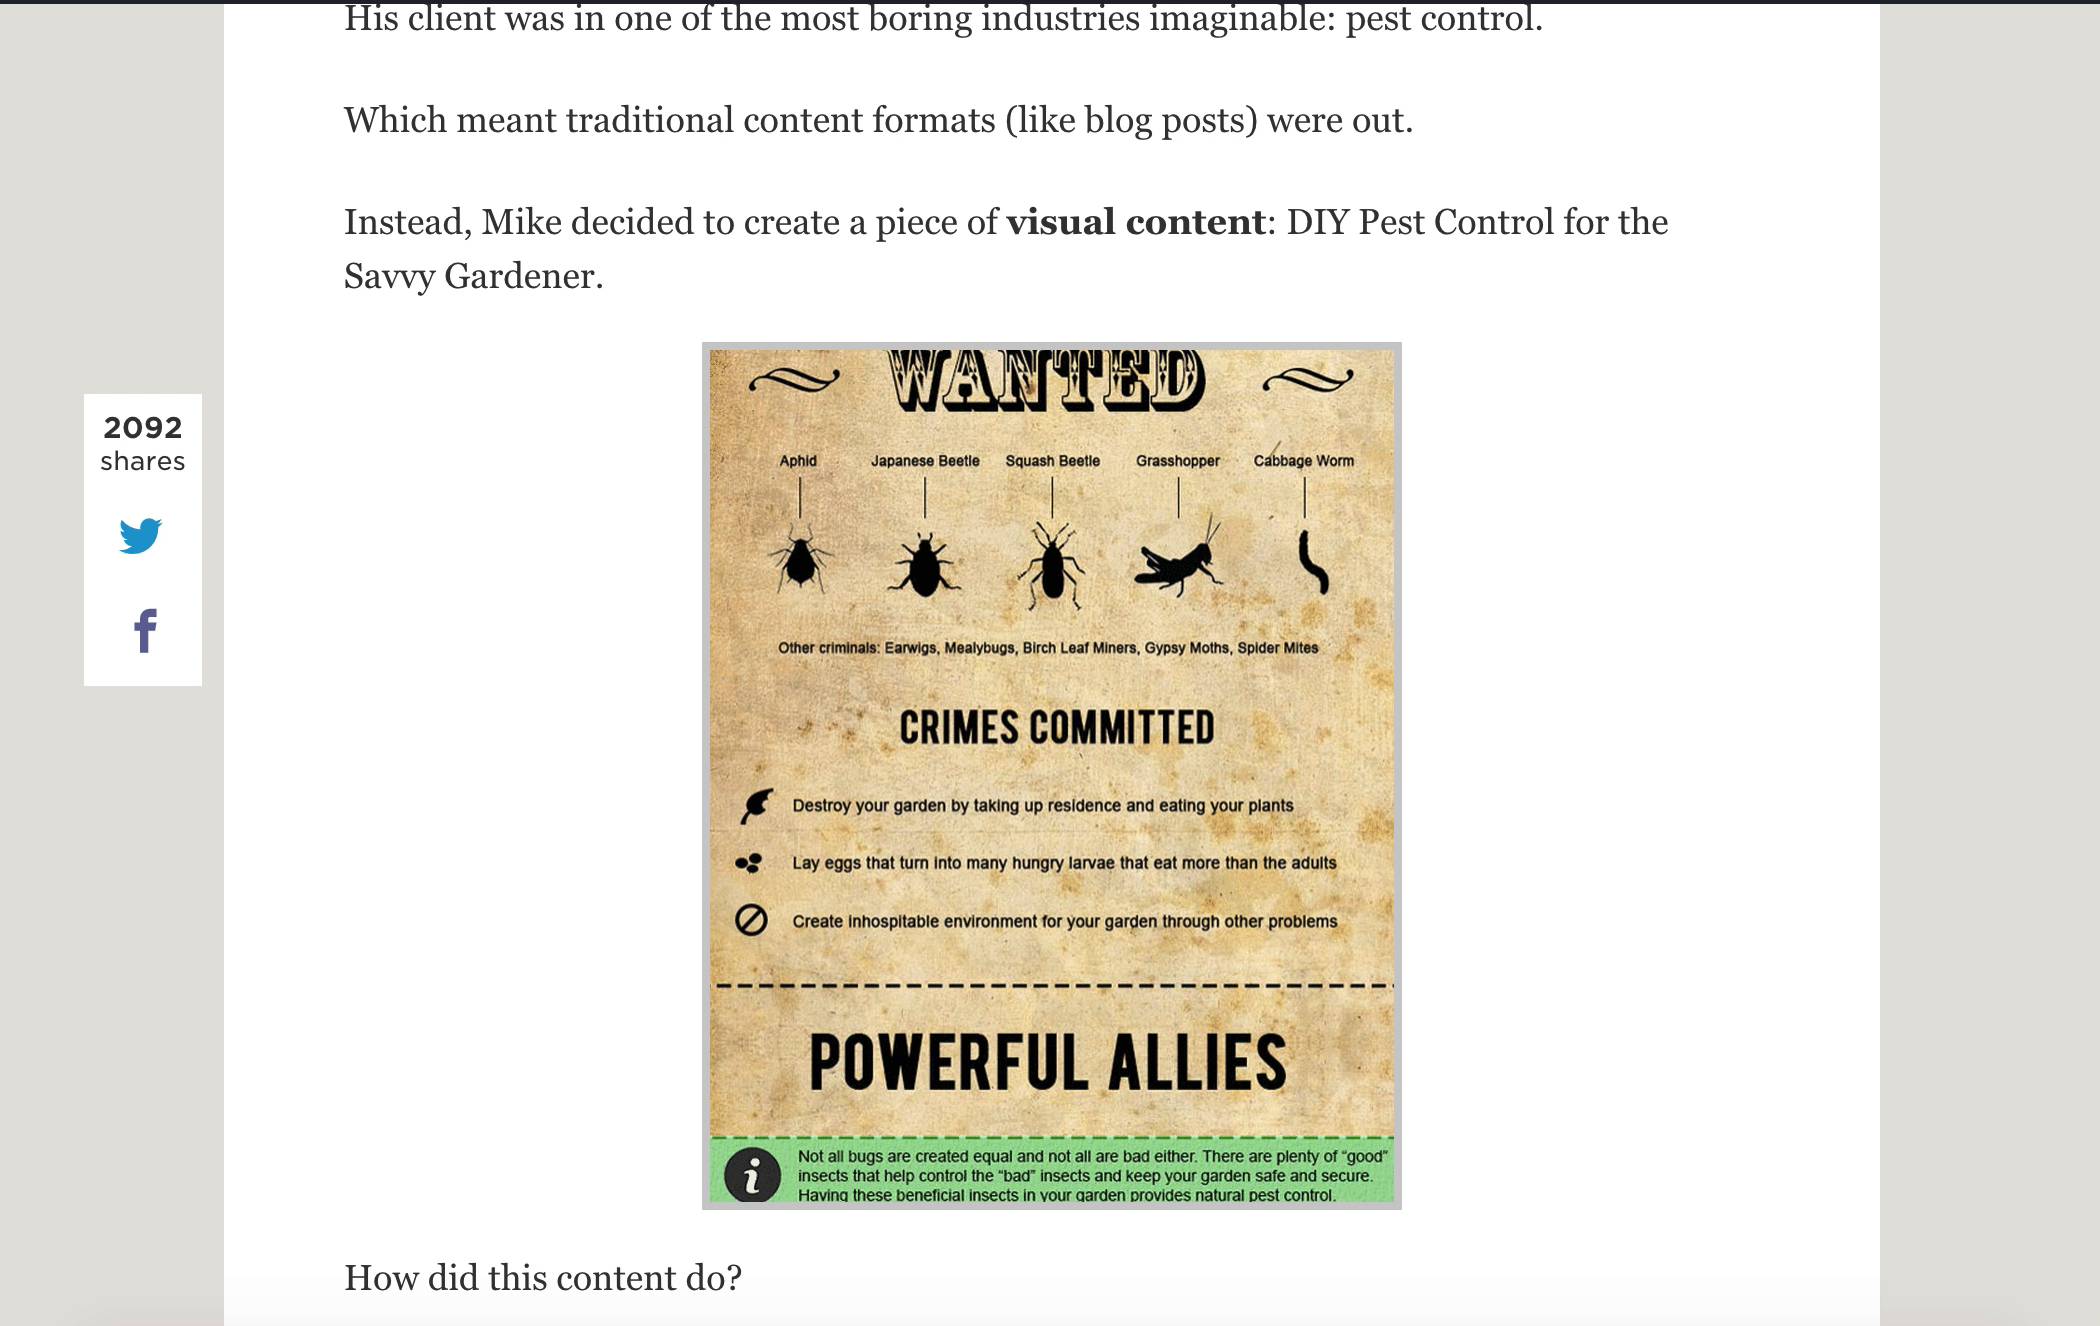
4. Infographic Guest Posts
What It Is:
Guest posting on with an infographic… instead of a traditional guest post.
Why It Works:
Getting your post published on an authority site can be TOUGH.
(Especially when you’re first starting out.)
But when you offer an infographic as your guest post, you’re giving the site owner an offer they can’t refuse.
Example:
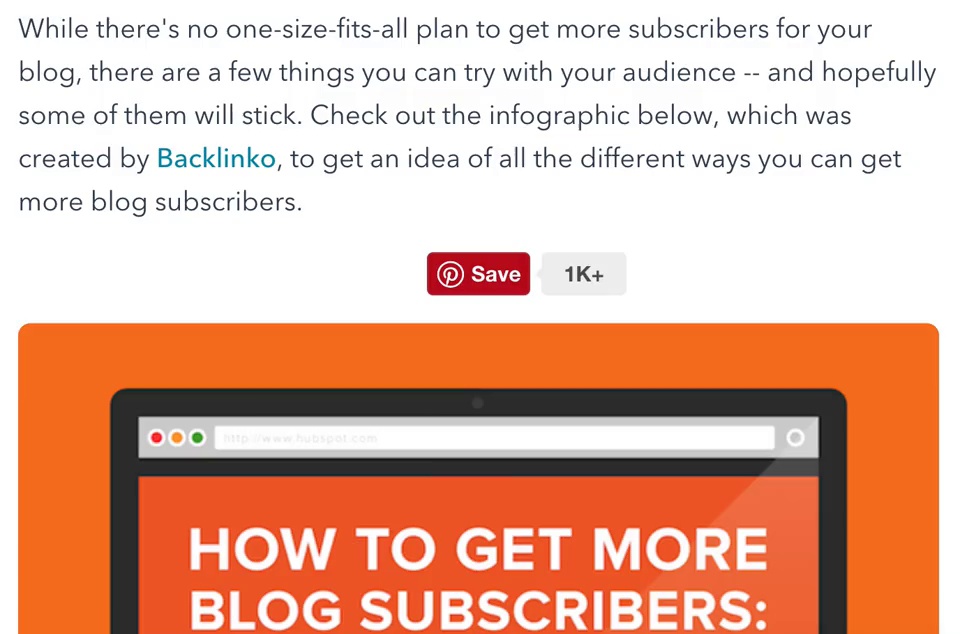
When I first started my blog, I wanted to get published on one of the world’s most popular digital marketing blogs: HubSpot.

The problem was:
I was a nobody with a tiny blog that nobody read.
Why would they want my content?
That’s when I decided:
“Instead of a traditional article, I’ll pitch them an infographic.”
And it worked!
My infographic guest post was published that same week:
5. Data Visualizations
What It Is:
A visual form of data… like a chart or a graph.
Why It Works:
Raw numbers are REALLY hard to understand. But the right visual can make you say: “I totally get it now”.
Plus, despite the fancy name, visualizing data doesn’t have to be hard or expensive.
Speaking of…
Example:
In 2019. I have published an email marketing guide.

But instead of just citing stats, I decided to visualize them:

(As you can see, these charts are NOT fancy. You can probably create something similar in Photoshop.)
And just like with Concept Visuals, people started using my simple charts in their content:

Nice.
6. Embedded Blog Post Videos
What It Is:
A short piece of video content (30-60 seconds) embedded in a blog post.
Why It Works:
Video is PERFECT for explaining certain concepts, strategies or techniques (that’s one reason that video is a super popular marketing strategy right now).
Plus, Embedded Blog Post Videos are an easy way to add multimedia to your content.
Example:
I use Embedded Blog Post Videos in lots of my posts.
Like this one where I use a video to describe a strategy:
7. YouTube Videos
What It Is:
A video… on YouTube. 🙂
Why It Works:
YouTube is the world’s 2nd most popular website (Alexa).

(And growing FAST.)
So if you’re serious about content marketing, YouTube is an absolute must.
Example:
Over the last few years I’ve been able to grow my YouTube channel from scratch to over 440k subscribers:

To date, my videos have been viewed over 12 million times:

As you might have guessed, this has funneled a ton of people back to my website:
8. Flowcharts
What It Is:
A way to visualize a process.
Why It Works:
A flowchart makes understanding “if X then Y” concepts a cinch.
(For example, “If your computer is frozen, restart. If that doesn’t work, run a virus scanner”.)
Plus, they’re easy to embed and share.
Example:
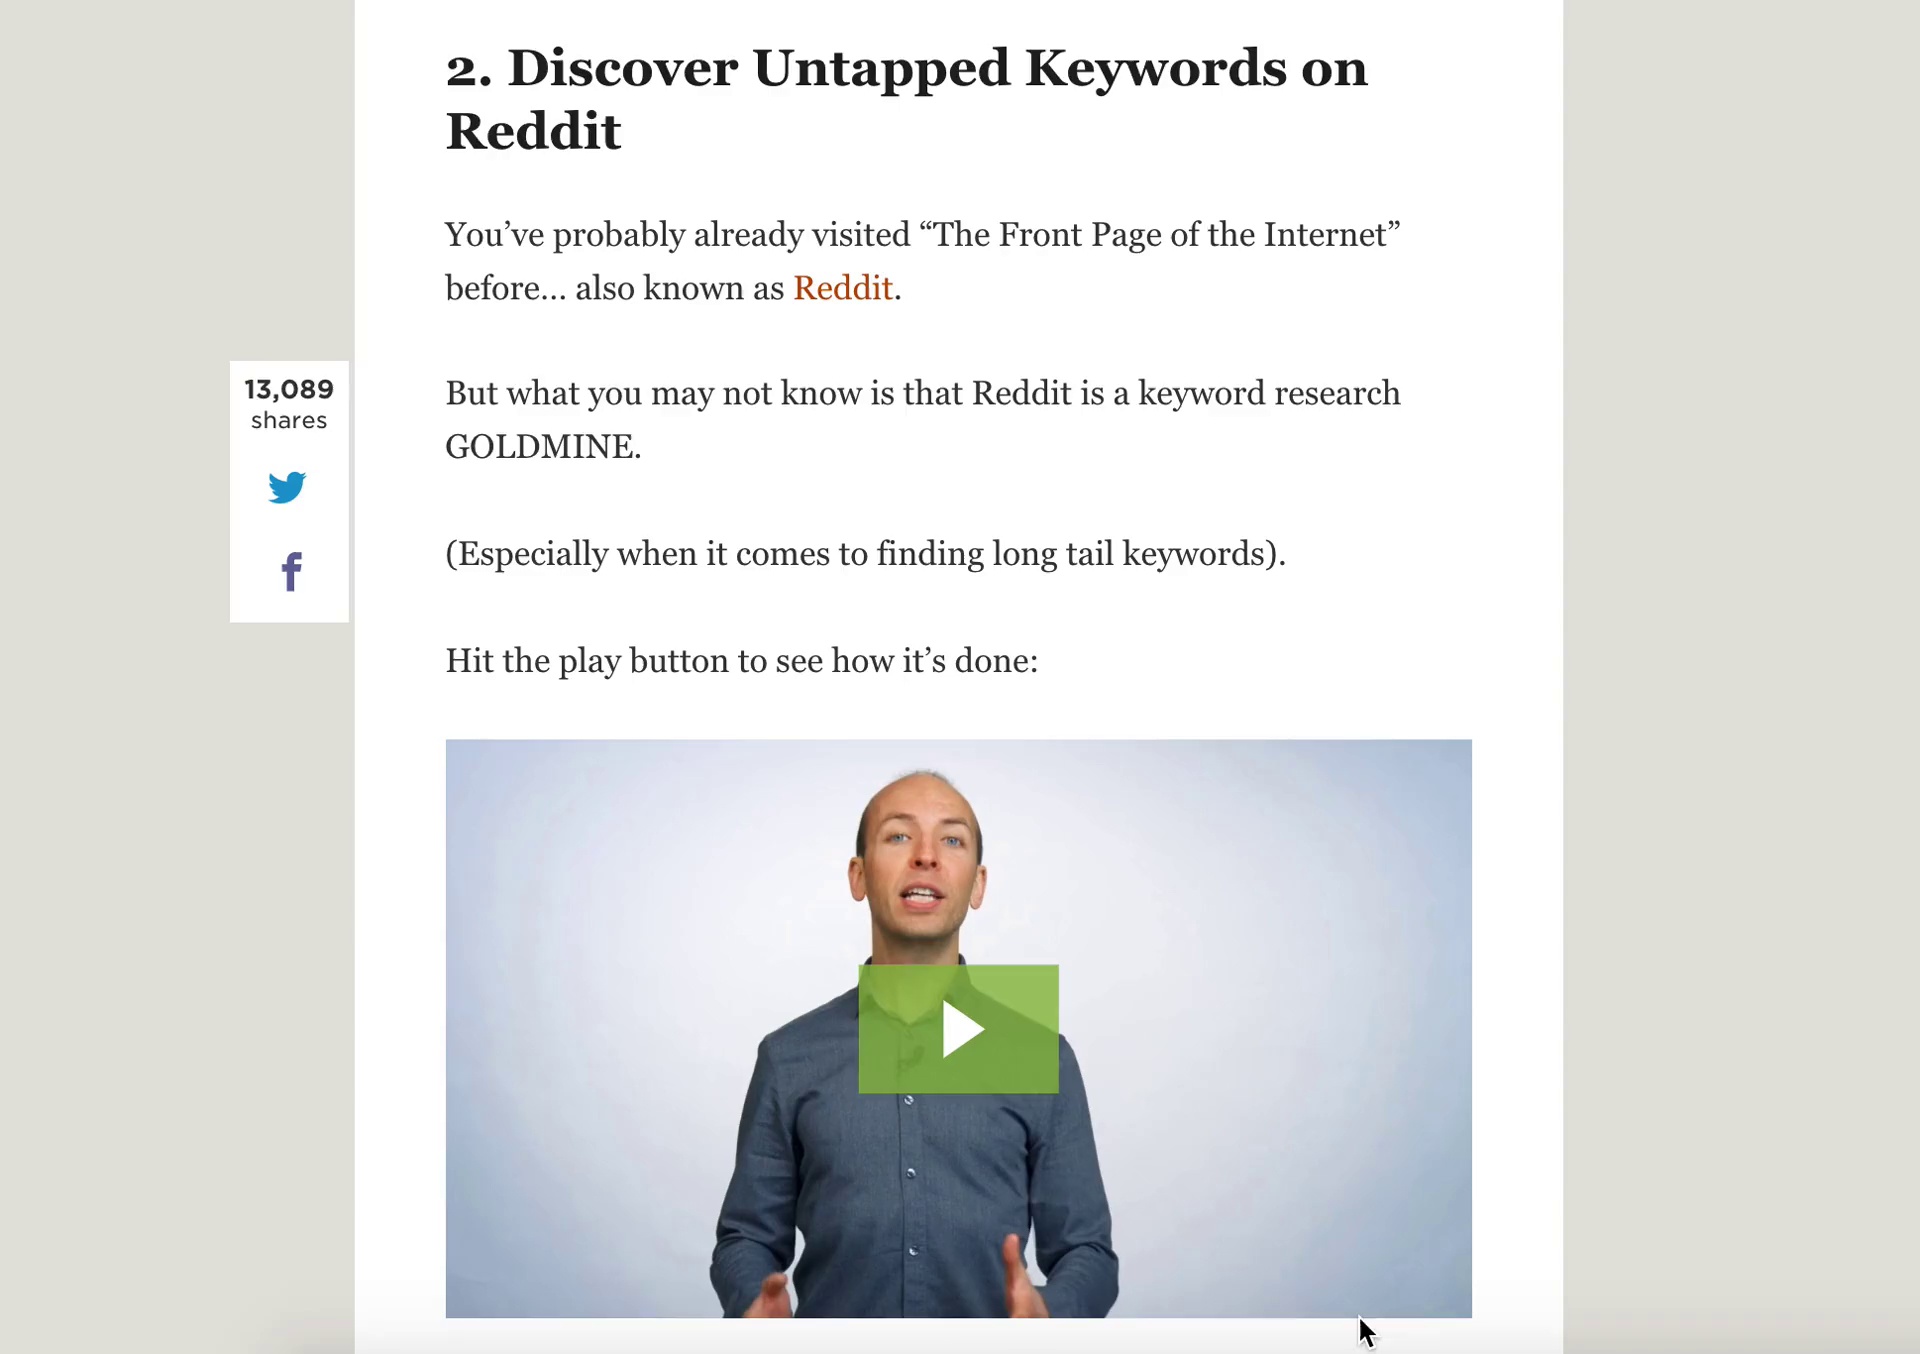
Some time ago I wrote a post about Google’s AI algorithm: RankBrain.

And I wanted to explain how RankBrain measures the way people interact with the search results.
The problem was:
How could I visualize how this process worked?
Then it hit me: a flowchart.
So I whipped up this simple flowchart visual.

And this visual helped make the process easy for non-techies (like me) to understand.

That said:
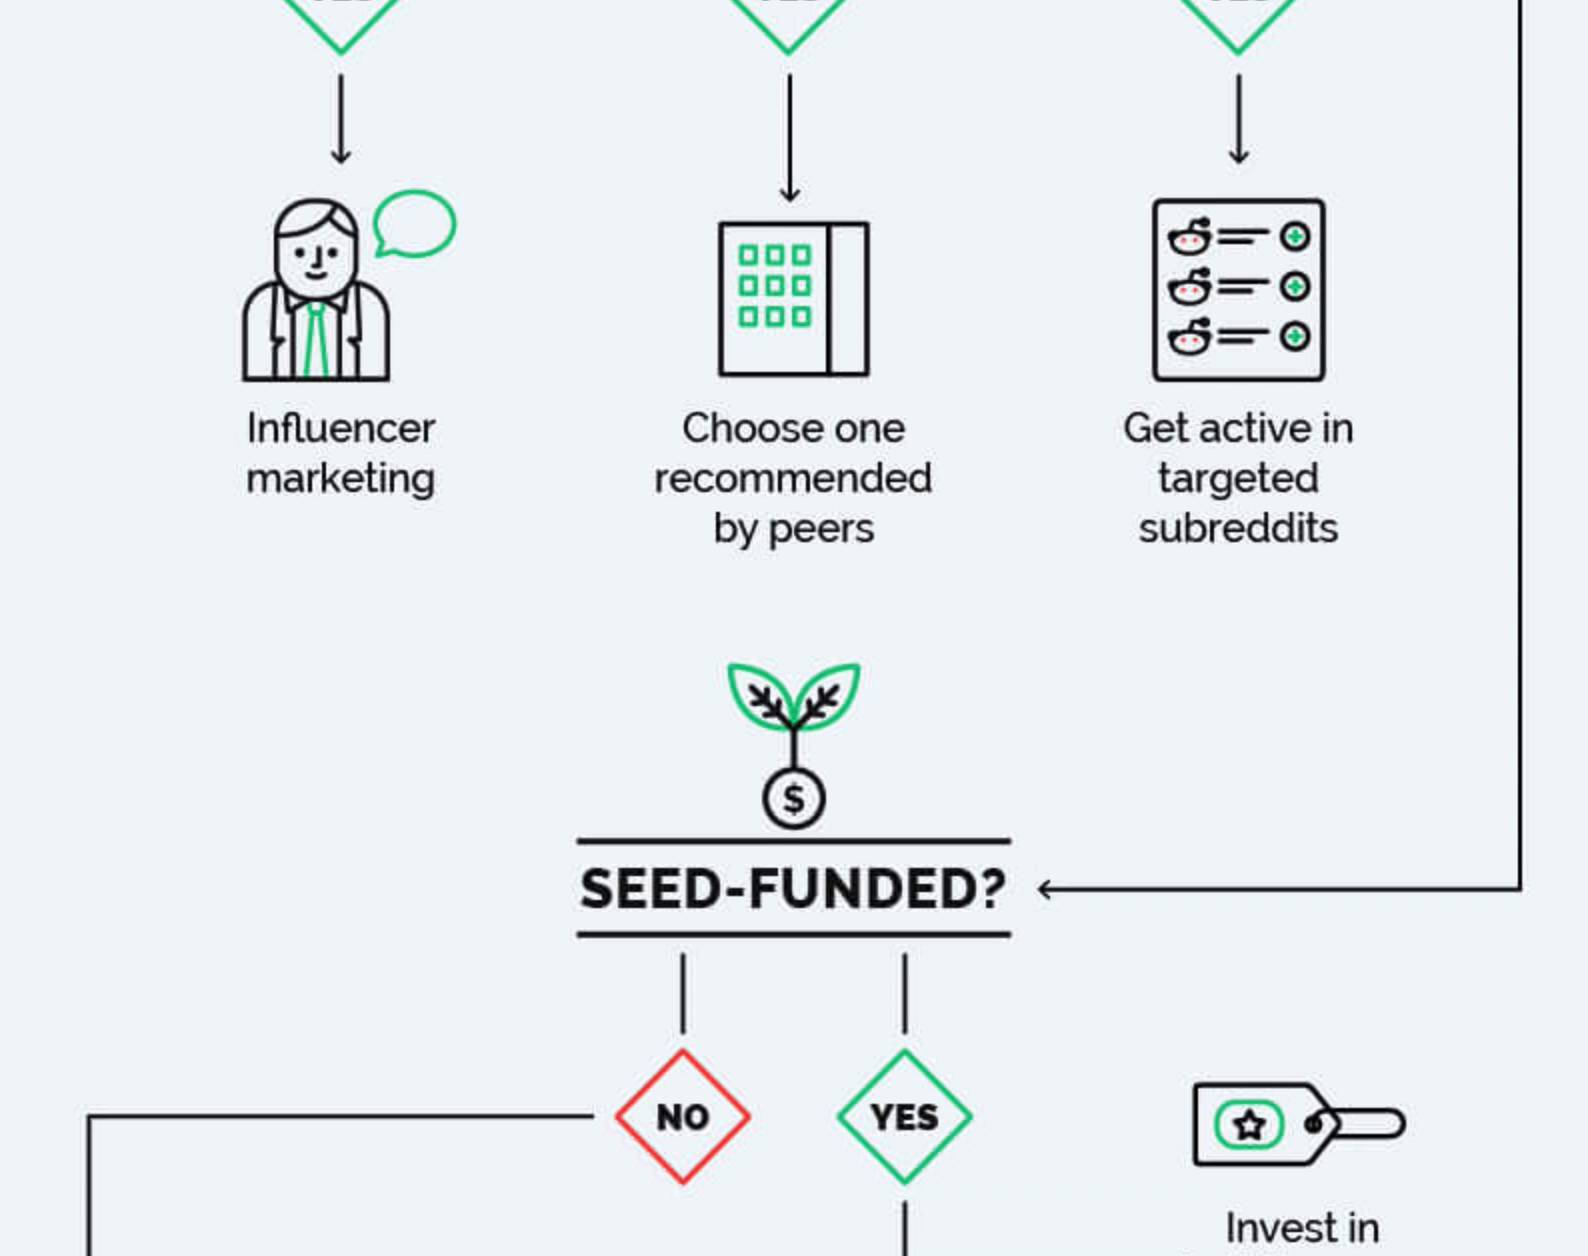
Your flowcharts don’t have to be simple. In fact, a big ol’ flowchart can give your content that “wow!” factor that pushes people to share.
For example, here’s a giant step-by-step flowchart I created a few years back:
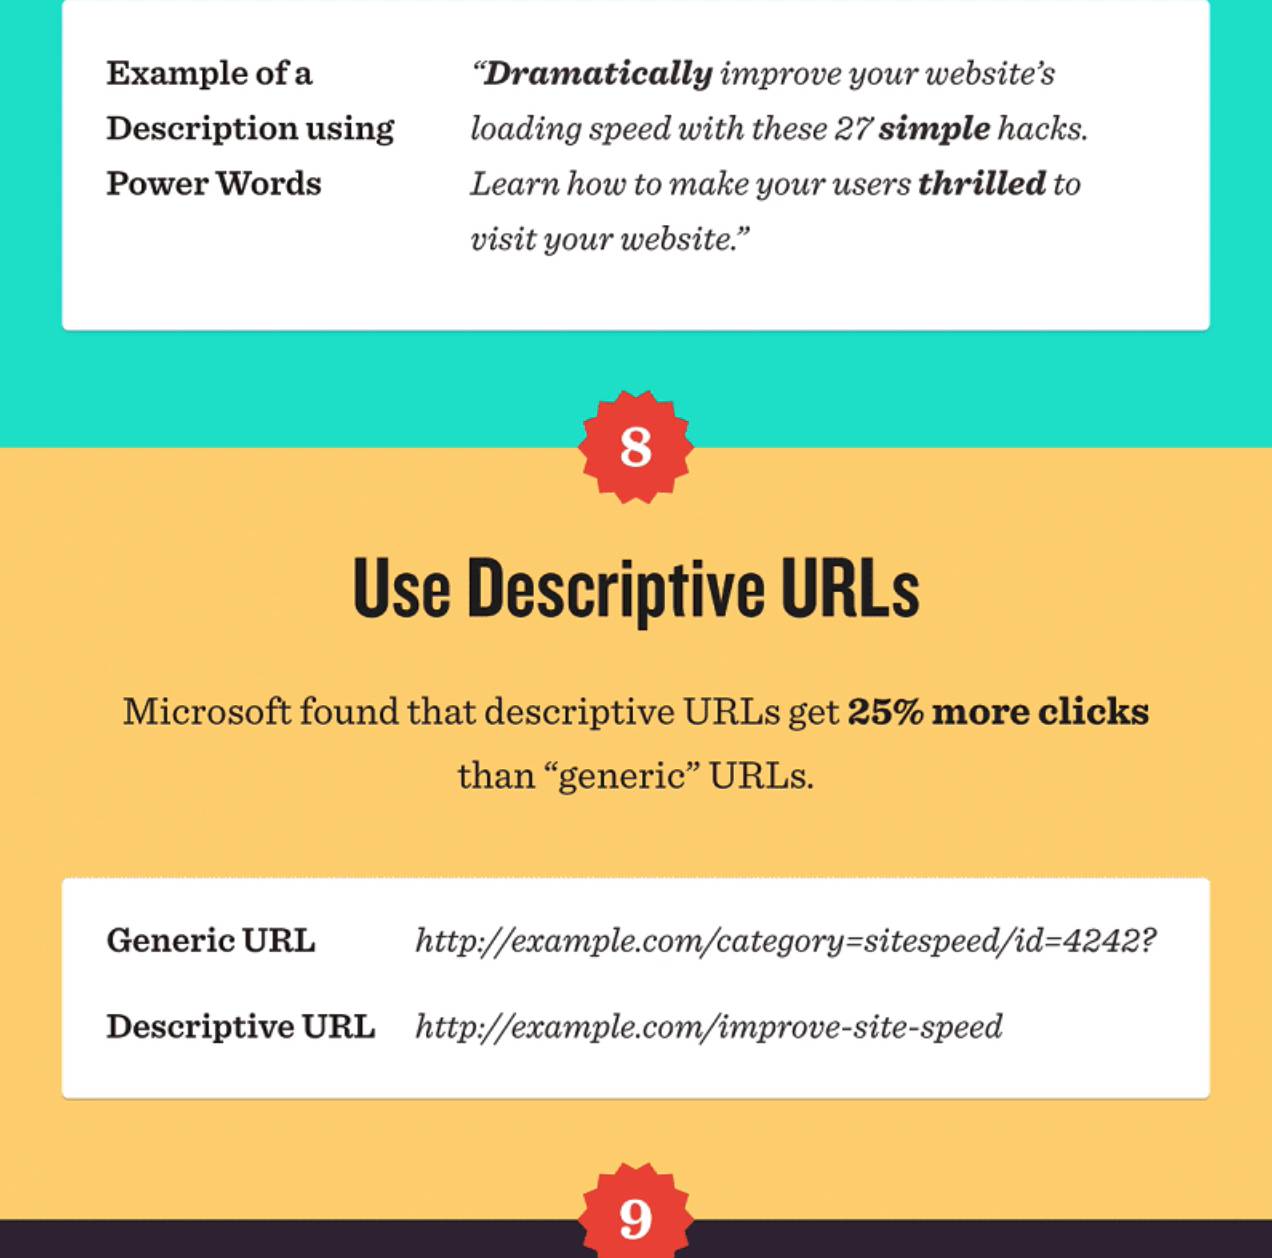
9. Explainer Infographics
What It Is:
An infographic that teaches someone a new strategy or approach.
Why It Works:
Most infographics are the same old stuff: pie charts and graphs.
Yawn.
But infographics aren’t for visualizing data.
They’re a powerful teaching tool.
Example:
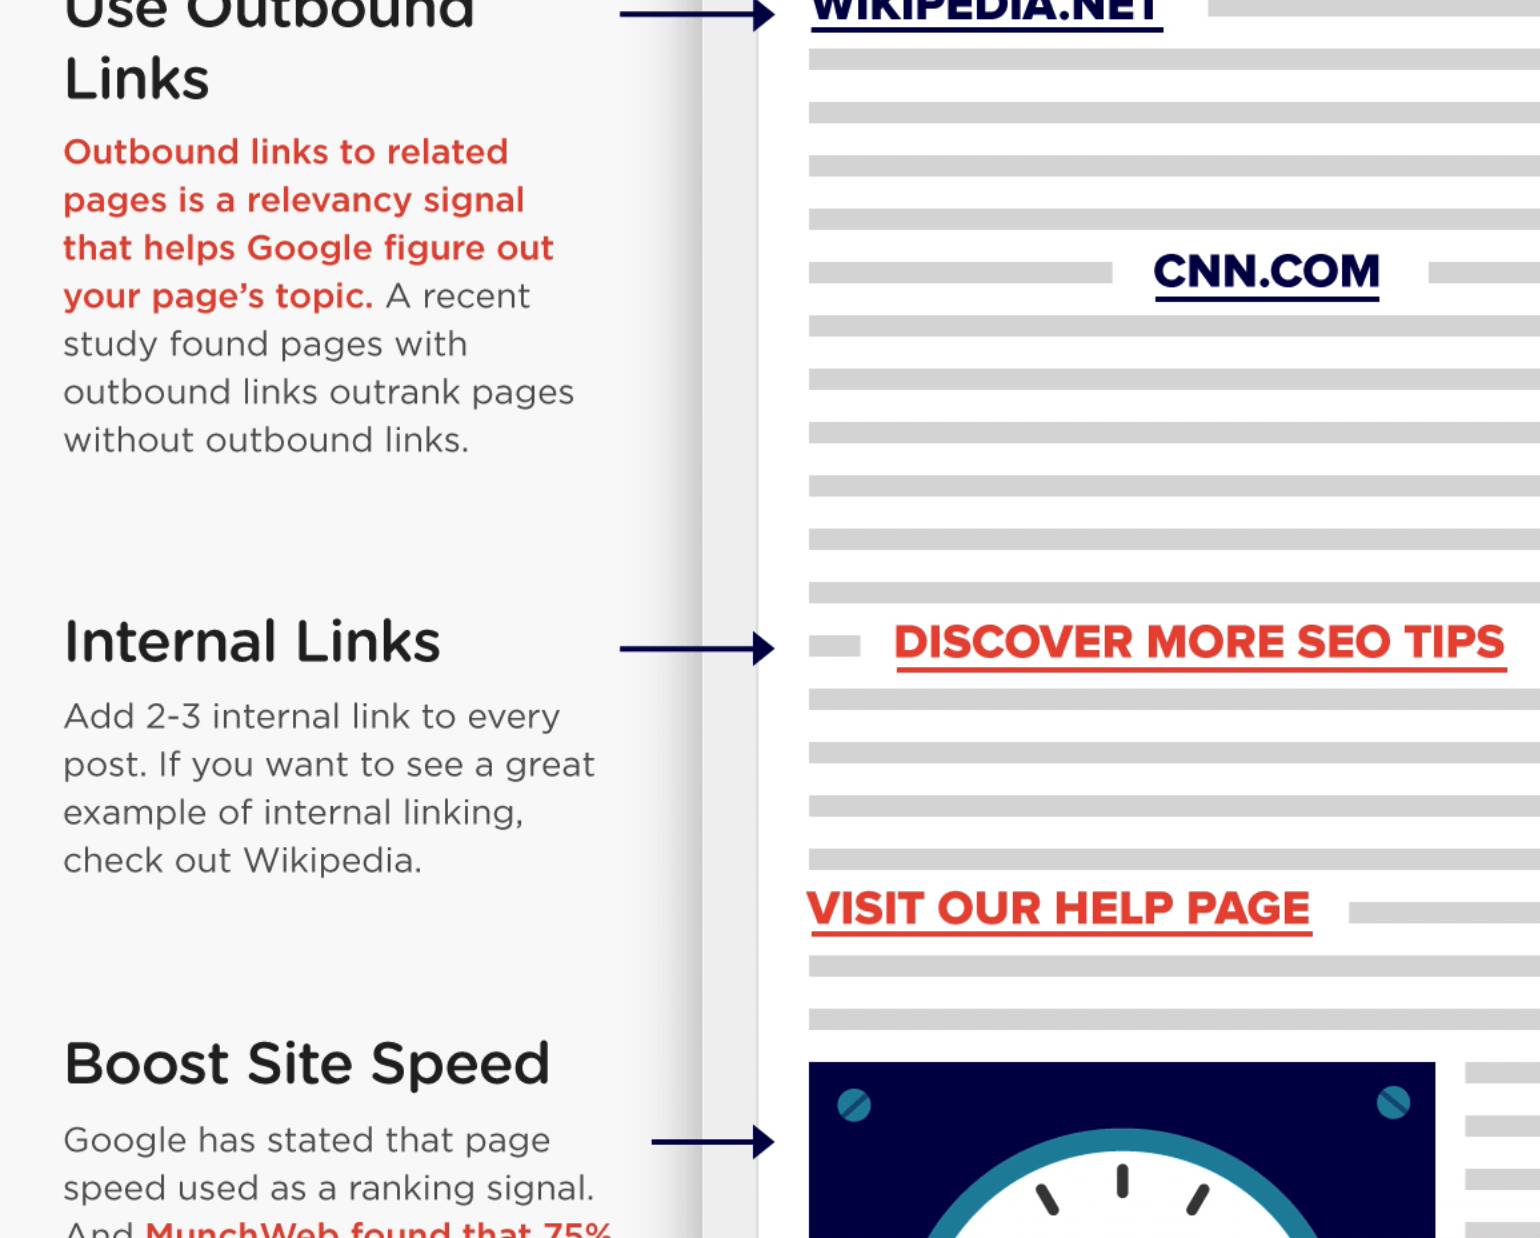
This on-page SEO infographic is one of the most successful pieces of content that I’ve ever published.
This infographic has resulted in 825 comments:

And 19,271 social media shares:

10. Screenshots
What It Is:
An image of your screen (whether that’s your desktop PC or iPhone screen)
Why It Works:
Screenshots help bring technical content to life.
“Do X. Then click Y” is boring and hard to follow.
But showing people the same thing with screenshots? That’s a different story.
Also, they’re an easy way to create original images (especially compared to infographics and videos).
Example:
I use lots of screenshots at Backlinko.
Screenshots to outline a process:

To visualize something I just explained:

Or to show people “behind the scenes” data:

If you want to get fancy, try using an animated GIF instead of a static screenshot:
It looks cool and helps show people exactly what to do.
I use GreenShot and TechSmith Capture to capture screenshots. But other people swear by Skitch.
Feel free to use whatever tool works best for you.
11. SlideShare Slidedecks
What It Is:
A set of presentation slides designed specifically for SlideShare.
Why It Works:
SlideShare is one of the world’s top 250 most-visited websites.
Despite being super popular, it doesn’t have a ton of competition for eyeballs. In fact, I’d consider SlideShare one of the biggest untapped content marketing strategies right now.
Example:
Gary Vee published this relatively simple deck to SlideShare some time ago:
Because the content was super valuable, his Slideshare presentation generated over 300k views in 2 weeks.

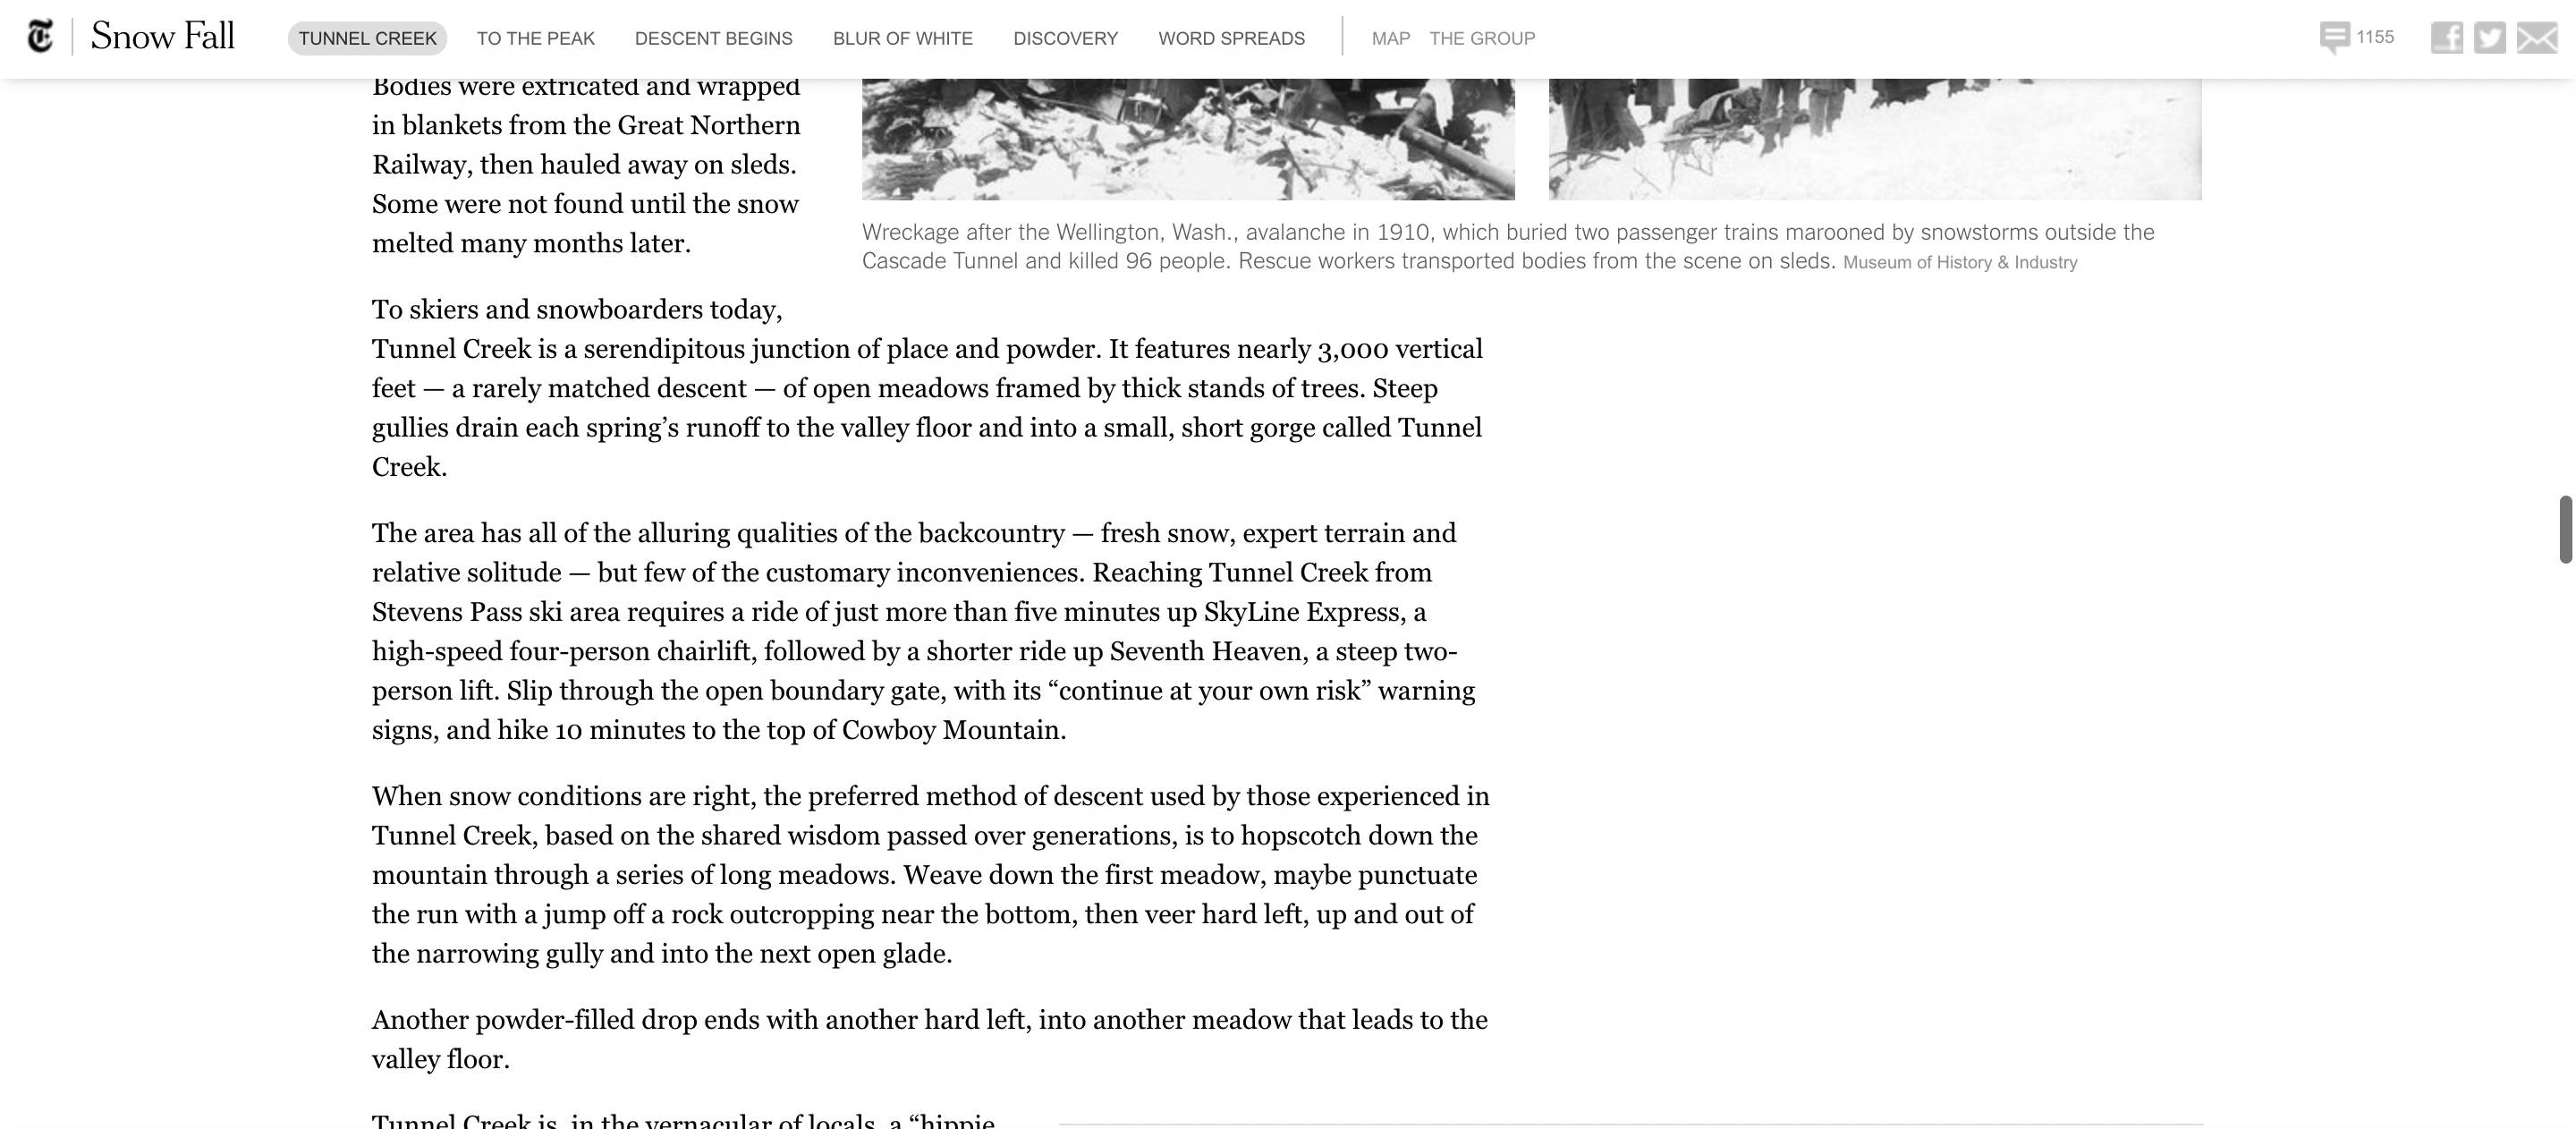
12. Interactive Content
What It Is:
Content that moves or changes based on how you interact with it.
Why It Works:
Interactive content INSTANTLY makes your content stand out from static blog posts on the same topic.
Example:
A few years back the New York Times released: “Snow Fall: The Avalanche at Tunnel Creek”.
")
It not only tells a compelling story…
…but moves and changes as you scroll down the page.
You can also use interactive content on landing pages to make them more compelling.
13. Visual Collection
What It Is:
A curated list presented in visual form.
Why It Works:
Content curation is an awesome way to publish valuable content… without needing to create anything new. And when you make your curation visual? It increases the perceived value 10 fold.
Example:
A LOT of people have recommended books on Tim Ferriss’s popular podcast.
The problem was:
To find these books you had to listen to every single episode.
That is, until one fan created fourhourbook.club.

It’s a visual list of every book mentioned on the podcast.
Because this list provided so much value (and looked cool), it CRUSHED on social media platforms…like Product Hunt:

(Which sent thousands of visits to the site overnight.)
14. Co-branded Infographics
What It Is:
An infographic that you create with another person or brand.
Why It Works:
You get a nice visual asset at half the cost (assuming you split the design costs with your partner). And because you’re doubling down on promotion, your infographic has a higher chance of going viral.
Example:
A few years back I teamed up with Larry Kim to create this high quality infographic:
We worked together on the content (which made the process 2x faster). And we split the costs 50/50.
Because the infographic was a joint effort, we co-branded it:
 – Close-up")
But here’s where things get interesting…
Because we both promoted the infographic, we doubled the number of eyeballs that saw it.
In fact, the infographic did so well that it was the #2 most popular SEO-related post on Search Engine Land that year:

Not bad.
15. Cartoons and Comic Strips
What It Is:
A way to explain an idea or concept in comic strip form… usually in a humorous way.
Why It Works:
VERY few content marketers use cartoons. So it’s an easy way for your online marketing to stand out.
(Especially in B2B.)
Also, comics are a surprisingly effective way to explain complicated concepts.
Example:
Well, you may already know about The Oatmeal.

It’s insanely popular site that’s almost 100% comic strips.
But you may not know that you can use comic strips inside of text-based content as a fun and effective way to explain something.
For example, here’s a comic I embedded in a post.

As you can see, this comic explains how Google tests and rolls out changes to their algorithm:
Now:
I could have just written out the same exact information.
But it wouldn’t have worked nearly as well.
In fact, my little comic strip got shared on marketing websites around the world:

16. Maps
What It Is:
Data presented as a map. The map can be of a country, a state, the world… it doesn’t really matter.
Why It Works:
News sites and blogs LOVE maps. Maps tend to get a lot of social shares and traffic… so news outlets don’t mind sharing and embedding them on their site.
And if you can make a map on a newsworthy topic — bingo! — you’ve got yourself a mention from an authority site.
Example:
There are literally hundreds of examples that I could point to.
(Maps are crushing it right now.)
But to give you an idea of how well a map can do, let’s take a look at this map: “Your State’s Favorite Reality TV Show”.

As you can see, nothing fancy.
In fact, I’d wager to guess that this map cost MUCH less than your average infographic.
Despite being simple, that map generated backlinks from 20 different sites:

Including a few links from authority B2C pop culture sites, like Cosmo.

How about one more example?
This map outlines how the US uses its land.
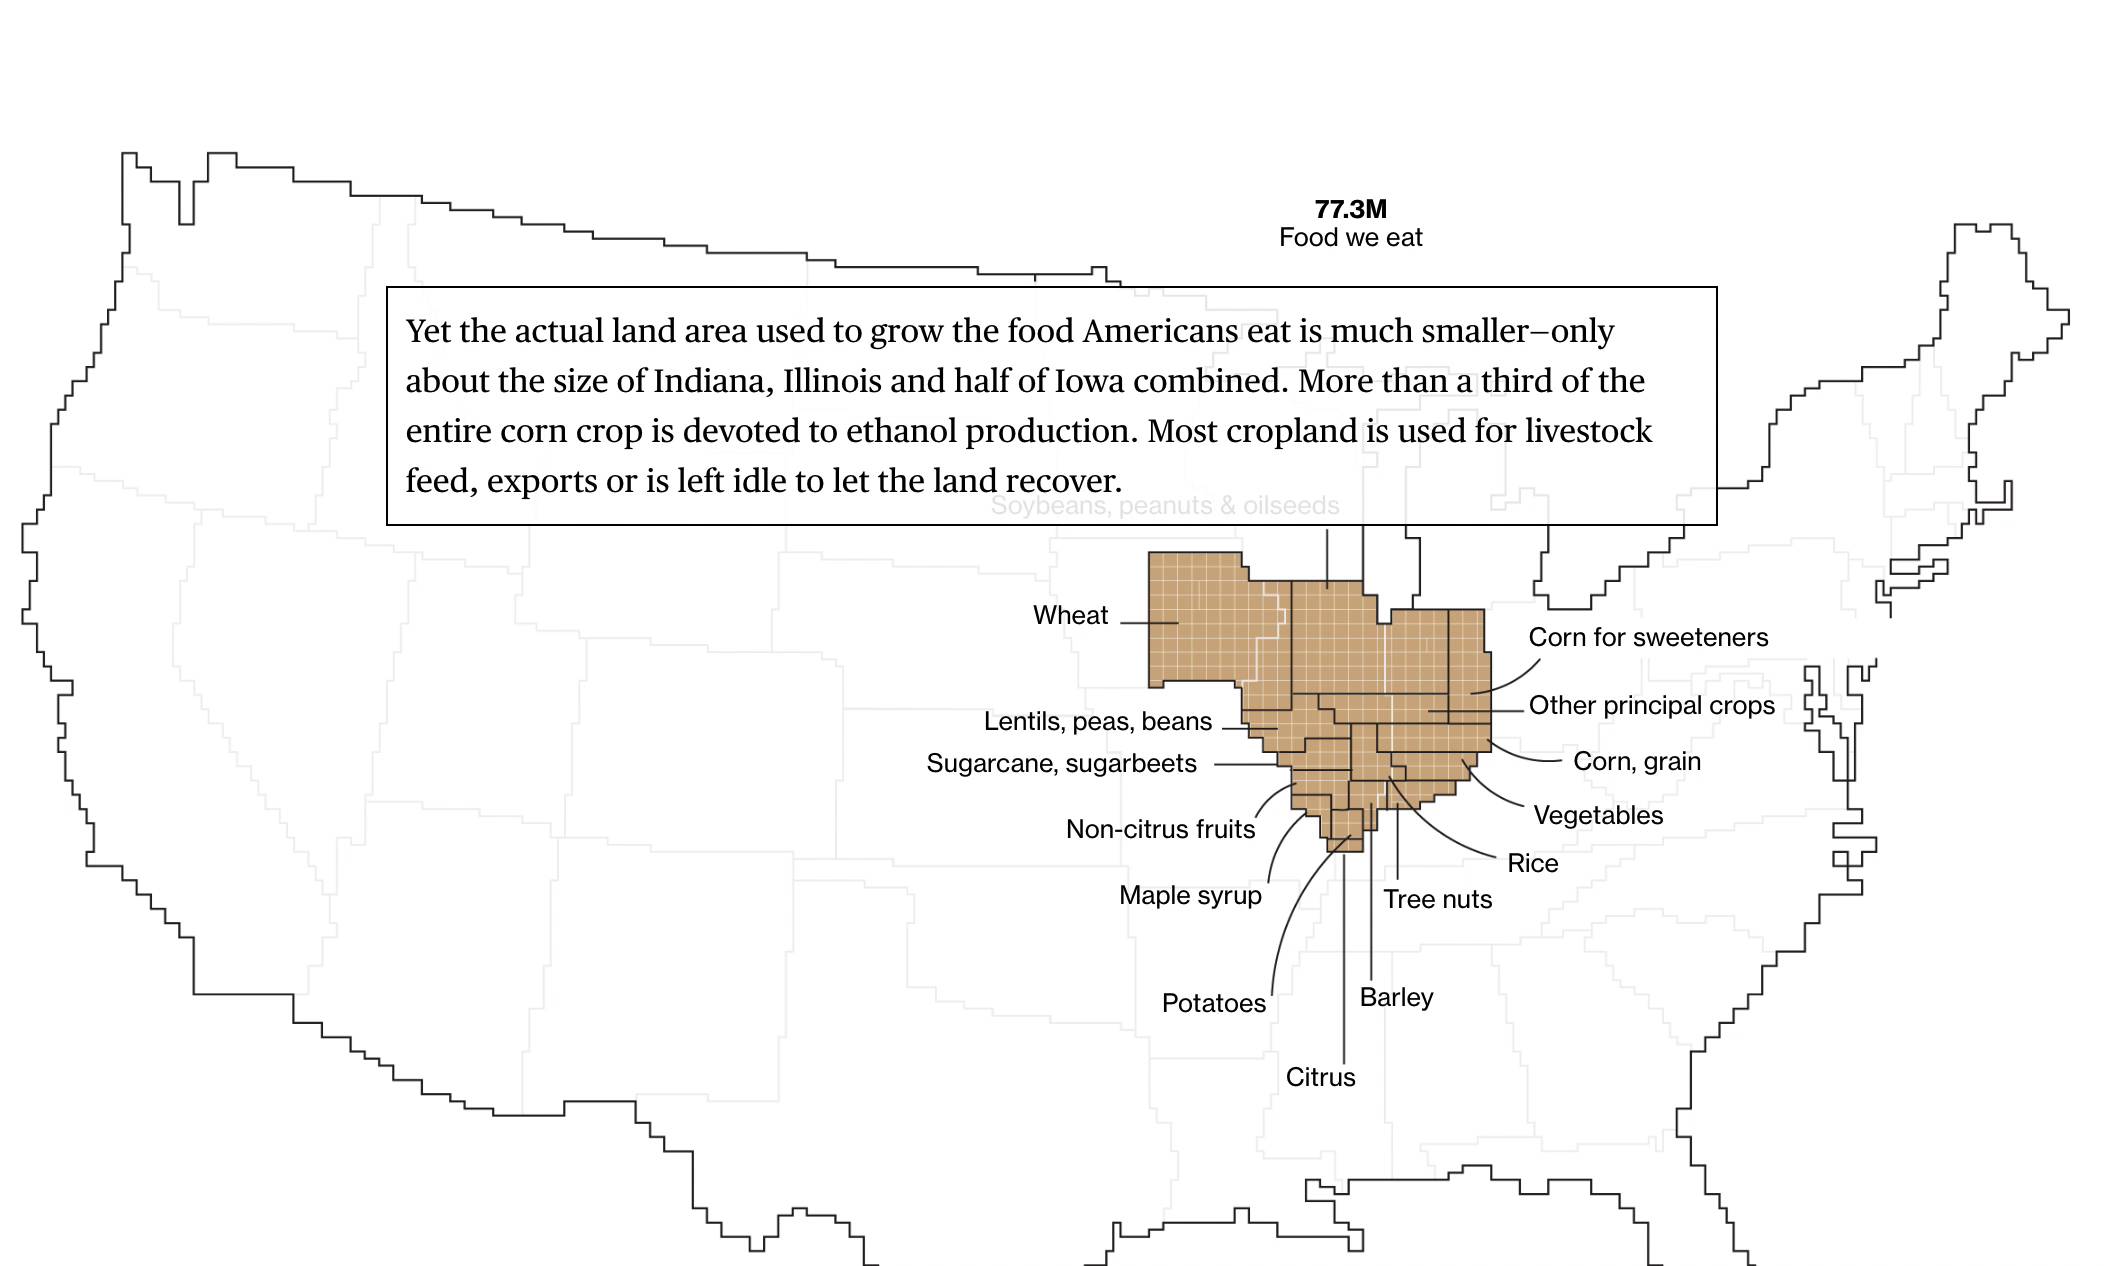
How did Bloomberg make this map?
They took data that was lying around (from the US Dept of Agriculture). And made it into a map.
(There are probably similar opportunities in your industry.)
And this map got linked to 20k+ times in less than 2 weeks!

Insane.
17. Blog Post Banners
What It Is:
A big banner that goes at the very top of a blog post.
Why It Works:
Simply put: it looks cool.
A banner also makes your content seem like a big deal… not just another blog post.
Especially if you compare them to what people use on their posts: lame stock photos.
Plus, they’re really easy to make (if you have graphic designs skills you can make a blog post banner using Adobe Illustrator or Canva).
Example:
Few years ago, I reviewed and rated 25 of the best free SEO tools on the market.

And to make my content stand out, I created a banner to go at the top of the page.
Simple. Yet effective.
Learn More
Can You Still Use Infographics to Build Links?: An in-depth look into how well infographics work today.
Repurposing Content: There’s no need to create every piece of visual content from square one. This guide will show you how to turn existing articles, interviews and presentations into visual content.